
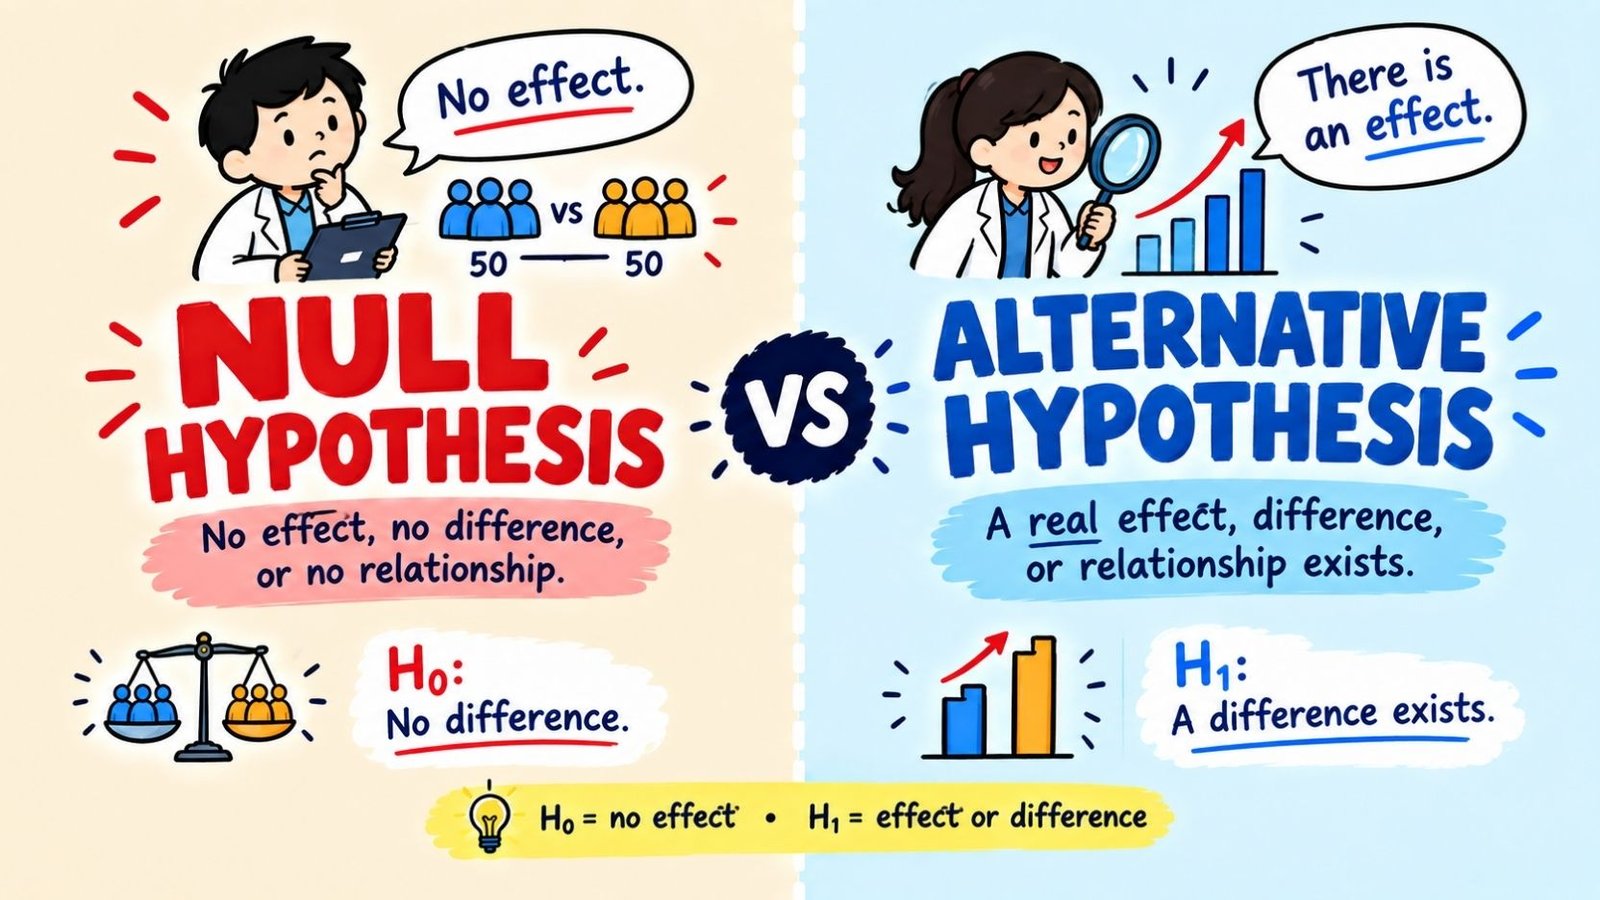
The null hypothesis is a statement that says there is no effect, no difference, or no relationship in the data you are studying. The alternative hypothesis is the opposite statement. It says there is an effect, a difference, or a relationship worth paying attention to. Every statistical test starts by comparing these two ideas against each other.
Understanding null hypothesis vs alternative hypothesis matters because it shapes how researchers design experiments, read results, and decide what to trust. Once you know how the two work together, p values, test statistics, and phrases like “reject the null” start to make a lot more sense. This guide walks through the meaning, the symbols, the examples, and the common mistakes people make.
What Is A Null Hypothesis?
The null hypothesis is the default assumption in a statistical test. It claims that nothing unusual is happening. There is no difference between groups. There is no relationship between variables. Any pattern you see in your sample is just random noise.
Researchers write the null hypothesis first because it acts as a baseline. You cannot prove a new idea is true just by looking at data. Instead, you test whether the data gives you enough reason to doubt the “nothing is happening” claim.
Simple definition: The null hypothesis says that any observed difference or relationship in your data happened by chance, not because of a real effect.
A few plain examples of null hypotheses:
- A new medicine has no effect on blood pressure compared to a placebo.
- There is no difference in test scores between students who study in the morning and students who study at night.
- A coin is fair, meaning it lands on heads about half the time.
See More: Hypothesis Or Hypotheses
What Is An Alternative Hypothesis?
The alternative hypothesis is the claim a researcher usually wants to support. It states that there is a real effect, a real difference, or a real relationship. It directly contradicts the null hypothesis.
Simple definition: The alternative hypothesis says the pattern in your data reflects something real, not just random chance.
Matching alternative hypotheses for the examples above:
- The new medicine does change blood pressure compared to a placebo.
- There is a difference in test scores between morning and evening studiers.
- The coin is not fair; it lands on one side more often than the other.
Null Hypothesis Vs Alternative Hypothesis: The Core Difference
The two hypotheses are built to be mutually exclusive. Only one of them can be true, and a statistical test is the tool used to decide which one the evidence supports.
| Feature | Null Hypothesis | Alternative Hypothesis |
| What it claims | No effect or no difference exists | An effect or difference exists |
| Symbol | H0 | H1 or Ha |
| Assumed true until | Evidence proves otherwise | Only accepted if H0 is rejected |
| Goal of the test | Starting point for comparison | What the researcher often hopes to support |
| Outcome language | “Fail to reject” or “reject” | “Supported” or “not supported” |
💡 Tip: Think of the null hypothesis as the position a courtroom takes at the start of a trial. The defendant is assumed innocent (no effect) until the evidence is strong enough to say otherwise.
Null Hypothesis Symbol and Alternative Hypothesis Symbol
Statisticians use short, standard symbols so hypotheses can be written quickly and read the same way across studies.
- Null hypothesis symbol: H0, read as “H naught” or “H zero.”
- Alternative hypothesis symbol: H1 or Ha, read as “H one” or “H alternative.”
These symbols show up in textbooks, research papers, and statistical software output. When you see H0 and H1 side by side in a study, they are describing the exact comparison covered in this article.
Null Hypothesis Vs Alternative Hypothesis Examples
Clear examples make the difference between these two ideas much easier to remember. Below are several examples covering common situations.
Example 1: Medicine and Blood Pressure
- H0: The new medicine has no effect on blood pressure.
- H1: The new medicine has an effect on blood pressure.
Example 2: Studying and Test Scores
- H0: There is no difference in test scores between students who study for one hour and students who study for two hours.
- H1: There is a difference in test scores between the two groups.
Example 3: Website Design and Click Rate
- H0: Changing the button color does not change the click rate.
- H1: Changing the button color does change the click rate.
Example 4: Coin Fairness
- H0: The coin is fair, and the probability of heads is 0.5.
- H1: The coin is not fair, and the probability of heads is not 0.5.
Each pair follows the same pattern. The null hypothesis says “no change,” and the alternative hypothesis says “there is a change.”
Null Hypothesis Vs Alternative Hypothesis In Statistics
In formal statistics, a hypothesis test is a structured way of deciding whether sample data provides enough evidence to reject H0 in favor of H1. The process typically follows these steps:
- State the null hypothesis and the alternative hypothesis.
- Choose a significance level, often written as alpha, commonly set at 0.05.
- Collect data and calculate a test statistic.
- Calculate a p value based on that test statistic.
- Compare the p value to the significance level.
- Decide whether to reject the null hypothesis or fail to reject it.
This structure is used across many fields, including psychology, biology, medicine, economics, and quality control.
Null Hypothesis Vs Alternative Hypothesis P Value
The p value is the probability of seeing a result at least as extreme as the one observed, assuming the null hypothesis is actually true. It does not tell you the probability that H0 is true. It tells you how surprising your data would be if H0 were true.
- A small p value (commonly below 0.05) suggests the observed data is unlikely under H0. This supports rejecting H0 in favor of H1.
- A large p value suggests the observed data is reasonably consistent with H0. This means there is not enough evidence to reject H0.
⚠️ Common mistake: A large p value does not prove the null hypothesis is true. It only means the test did not find strong enough evidence against it.
Reject Or Fail To Reject The Null Hypothesis
This is one of the most misunderstood parts of hypothesis testing. Statisticians almost never say a hypothesis is “proven true.” Instead, they describe two possible decisions.
When to Reject the Null Hypothesis
You reject H0 when the p value is smaller than your chosen significance level. This means the data provides strong enough evidence to support the alternative hypothesis instead.
When to Fail to Reject the Null Hypothesis
You fail to reject H0 when the p value is larger than your significance level. This does not mean H0 is proven correct. It simply means your data did not give enough evidence to abandon it.
✅ Correct phrasing: “We reject the null hypothesis” or “We fail to reject the null hypothesis.”
❌ Incorrect phrasing: “We accept the null hypothesis” or “We prove the null hypothesis is true.”
Statisticians avoid the word “accept” because absence of evidence is not the same as evidence of absence. A study might simply be too small to detect a real effect.
See More: Inexcusable Vs Unexcusable
Null Hypothesis Vs Alternative Hypothesis Curve And Graph
Hypothesis tests are often shown visually using a bell-shaped distribution curve, especially in tests based on the normal distribution.
- The curve represents the range of possible outcomes if H0 is true.
- A rejection region is marked at one or both tails of the curve. This region represents outcomes considered too extreme to be explained by chance alone.
- If your test statistic lands inside the rejection region, you reject H0.
- If it lands outside the rejection region, you fail to reject H0.
In a two-tailed test, the rejection regions sit at both ends of the curve, because the alternative hypothesis allows the effect to go in either direction. In a one-tailed test, the rejection region sits at only one end, because the alternative hypothesis specifies a direction, such as “greater than” or “less than.”
One-Tailed Vs Two-Tailed Hypotheses
The wording of the alternative hypothesis determines whether a test is one-tailed or two-tailed.
| Type | Alternative Hypothesis Wording | Example |
| Two-tailed | Not equal to | The average height is not equal to 170 cm |
| One-tailed (right) | Greater than | The average height is greater than 170 cm |
| One-tailed (left) | Less than | The average height is less than 170 cm |
Choosing the correct type matters because it changes where the rejection region falls on the curve, and it changes how the p value is calculated.
Null Hypothesis Vs Alternative Hypothesis In Different Fields
The same logic applies across many subjects, though the specific claims change depending on the field.
In Psychology
A psychologist might test whether a new therapy reduces anxiety scores compared to no therapy. H0 states there is no difference in anxiety scores between the therapy group and the control group. H1 states there is a difference.
In Biology
A biologist might test whether a fertilizer increases plant growth. H0 states the fertilizer has no effect on growth. H1 states the fertilizer does affect growth.
In Business and Marketing
A marketing team might test whether a new advertisement increases sales. H0 states the advertisement has no effect on sales. H1 states the advertisement does affect sales.
In Quality Control
A factory might test whether a manufacturing process produces parts of the correct average length. H0 states the average length matches the target specification. H1 states it does not match.
How To Write A Null And Alternative Hypothesis
Writing a clear hypothesis pair is a skill that gets easier with practice. Follow these steps:
- Identify the question. What relationship or difference are you actually testing?
- Write the null hypothesis first. State that there is no effect, no difference, or no relationship.
- Write the alternative hypothesis. State the opposite of the null hypothesis, using the same variables.
- Match the direction. Decide if the alternative hypothesis should be two-tailed (not equal to) or one-tailed (greater than or less than).
- Use measurable language. Avoid vague wording. Refer to specific variables, groups, or values.
Example of a full pair:
- H0: The average delivery time for Company A and Company B is the same.
- H1: The average delivery time for Company A and Company B is different.
Null Hypothesis Vs Alternative Hypothesis: Common Mistakes
Even experienced students mix up parts of this topic. Here are frequent errors and how to correct them.
❌ Incorrect: Saying the null hypothesis was “proven.”
✅ Correct: Saying the null hypothesis was “not rejected,” since a hypothesis test cannot prove something is true.
❌ Incorrect: Writing H0 and H1 to overlap or say the same thing.
✅ Correct: Writing H0 and H1 so they are mutually exclusive and cover every possible outcome.
❌ Incorrect: Choosing a one-tailed test after already seeing the data, just to get a smaller p value.
✅ Correct: Deciding on a one-tailed or two-tailed test before collecting or looking at the data.
❌ Incorrect: Treating a p value as the probability that the null hypothesis is true.
✅ Correct: Understanding a p value as the probability of the observed data, assuming the null hypothesis is true.
Type I And Type II Errors
Because hypothesis testing relies on probability, mistakes are always possible. Two types of errors are especially important to understand.
| Error Type | What Happens | Example |
| Type I Error | Rejecting H0 when it is actually true | Concluding a medicine works when it actually does not |
| Type II Error | Failing to reject H0 when it is actually false | Concluding a medicine does not work when it actually does |
The significance level, alpha, controls the chance of a Type I error. A smaller alpha reduces the risk of falsely rejecting H0, but it can also make it harder to detect a real effect, raising the risk of a Type II error.
Null Hypothesis Vs Alternative Hypothesis Under The Chi Square Test
The chi square test is commonly used to check relationships between categorical variables, such as comparing survey answers across different groups.
- H0: There is no association between the two categorical variables.
- H1: There is an association between the two categorical variables.
For example, a researcher studying whether gender is related to preferred product color would set H0 as “gender and color preference are independent,” and H1 as “gender and color preference are related.”
See More: Filled Or Filed
Quick Summary Table
| Question | Null Hypothesis | Alternative Hypothesis |
| What does it claim? | No effect or difference | An effect or difference exists |
| Symbol used | H0 | H1 or Ha |
| Assumed at the start? | Yes | No |
| What rejecting it means | Evidence found against “no effect” | Supported by the evidence |
| What failing to reject it means | Not enough evidence against it | Not supported by the evidence |
Frequently Asked Questions
What is the difference between null hypothesis and alternative hypothesis?
The null hypothesis claims there is no effect or difference, while the alternative hypothesis claims there is one. A statistical test is used to decide which claim the data supports.
What is the symbol for the null hypothesis?
The null hypothesis is written as H0.
What is the symbol for the alternative hypothesis?
The alternative hypothesis is written as H1 or Ha.
When do you reject the null hypothesis?
You reject the null hypothesis when the p value from your test is smaller than your chosen significance level, usually 0.05.
Can you ever prove the null hypothesis is true?
No. A hypothesis test can only show that there is or is not enough evidence to reject H0. It cannot prove H0 is true.
Is the alternative hypothesis always what the researcher hopes to find?
Often, yes, but not always. Researchers may hope to confirm a real effect, but the test itself does not favor either hypothesis; it simply follows the evidence.
What is a Type I error in hypothesis testing?
A Type I error happens when you reject a null hypothesis that was actually true.
What is a Type II error in hypothesis testing?
A Type II error happens when you fail to reject a null hypothesis that was actually false.
How do you know if a test should be one-tailed or two-tailed?
It depends on how the alternative hypothesis is worded. If it specifies a direction, such as “greater than,” the test is one-tailed. If it only says “not equal to,” the test is two-tailed.
Final Thoughts
Null hypothesis vs alternative hypothesis comes down to one simple contrast: one claims nothing is happening, and the other claims something real is going on. Every hypothesis test is built around comparing these two statements and letting the data decide which one holds up.
Once you can confidently write H0 and H1, understand what a p value actually measures, and know why researchers say “fail to reject” instead of “accept,” the rest of hypothesis testing becomes much easier to follow. These two hypotheses are the foundation that the whole process is built on.

Zunaira Qasim is the author and creator of Gramvixo, dedicated to making English grammar easier for learners and everyday writers. With 4 years of experience researching grammar, confusing words, word choices, and common language mistakes, they create clear and practical content that helps readers understand English and use it with confidence.
3 Comments